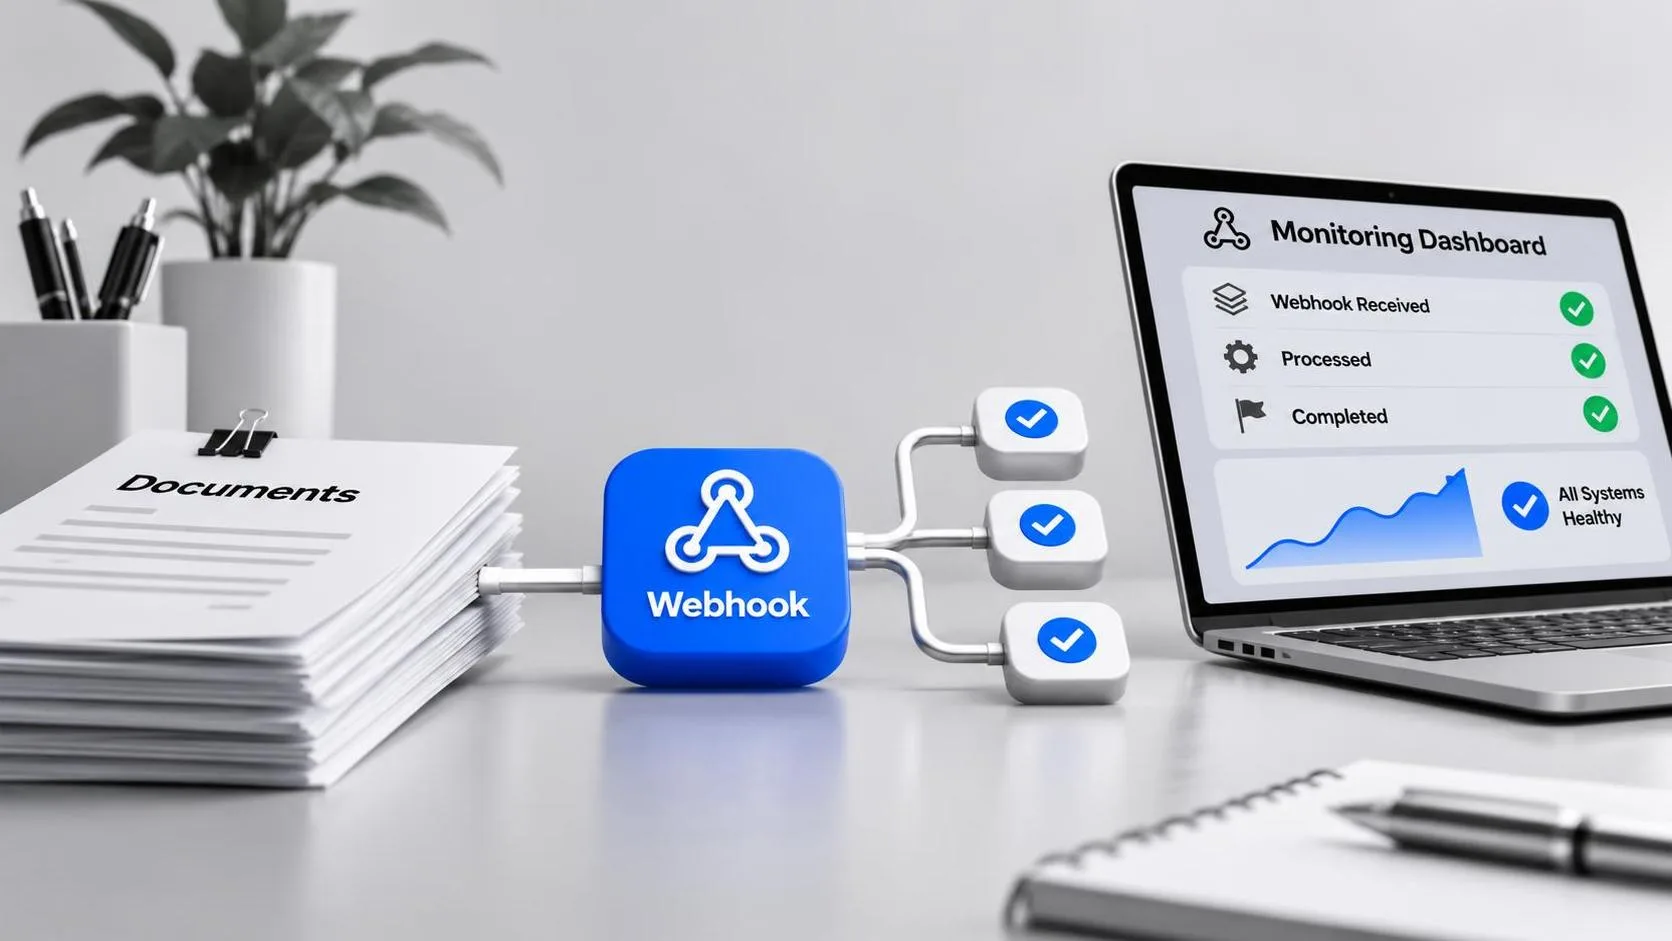
Webhook monitoring for Gemini-powered document processing is less about watching one API call and more about tracing an entire workflow. A typical pipeline accepts a PDF, stores it in cloud storage, sends content to Gemini for extraction or classification, writes the result to a database, and notifies another service. Any handoff can fail.
The demo is easy. The edge cases are the real tutorial. In this guide, I will show the smallest useful monitoring design, the signals worth collecting, and the failure handling I would add before putting an AI document workflow in front of customers.
What the webhook actually represents
A webhook is an HTTP request sent from one system to another when an event occurs. In a document pipeline, the event might be processing.started, processing.completed, or processing.failed. The sender posts a JSON payload to your endpoint, and your application acknowledges it with a successful HTTP response.
Gemini-powered document processing does not automatically mean that Gemini itself sends a webhook for every integration. In many systems, your worker calls the Gemini API, waits for a response, and then your own orchestration layer emits the callback. Other designs use a queue, Cloud Run job, Pub/Sub subscriber, or third-party automation platform between those steps. Monitoring should cover that actual architecture rather than assume the model provider owns the whole lifecycle.
The payload should include a stable document ID, workflow ID, event type, creation time, attempt number, model identifier, and a correlation ID. Do not place an entire sensitive contract or medical form in a webhook unless there is a strong reason. Store the document securely and send references, status, and summarized error information instead.
The smallest monitoring setup that works
Here is the smallest version that works. Add structured logs at four points: request accepted, model request started, model response received, and final callback delivered. Each log line should use the same workflow ID. With that one decision, you can answer whether a document disappeared before Gemini, failed during extraction, or completed but never reached the customer system.
Create a dashboard with four basic measurements. First, track webhook acceptance rate, meaning the percentage of incoming events that receive a successful response. Second, measure callback latency from event creation to receipt. Third, count processing failures by stage. Fourth, track retries and duplicate event IDs.
For a small application, an OpenTelemetry-compatible collector plus Google Cloud Logging and Cloud Monitoring is enough. A team already using Datadog, New Relic, Grafana, or Honeycomb can send the same structured events there. The brand matters less than consistent fields and useful alerts.
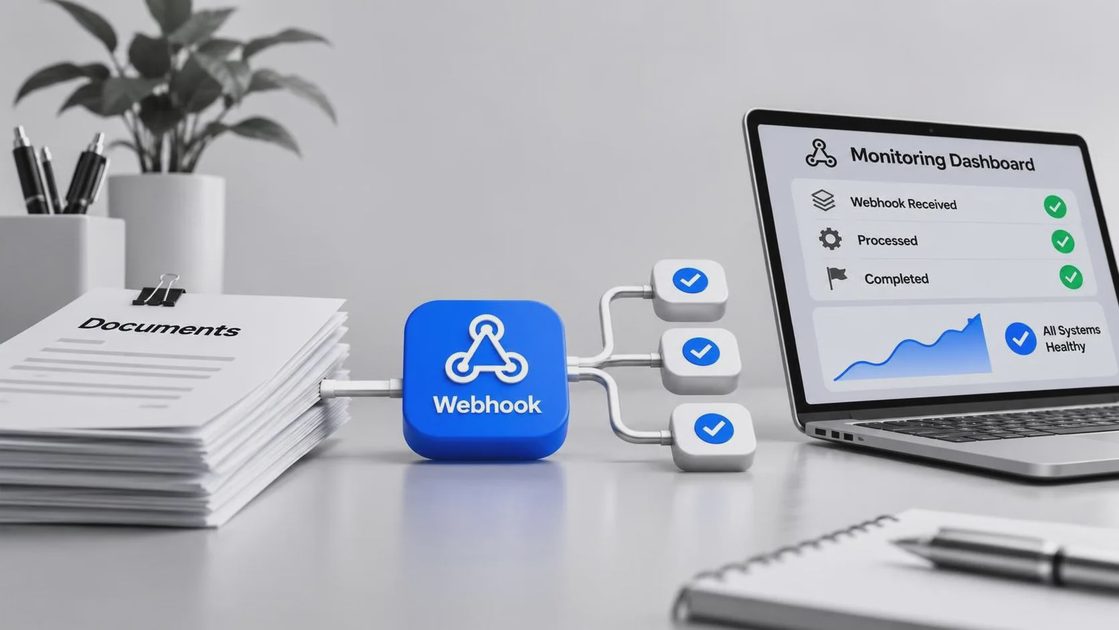
Do not alert on every individual failed document. One malformed upload should create a searchable error, not wake someone at 2 a.m. Alert when failure rates cross a threshold, when latency remains elevated for several minutes, or when a downstream endpoint rejects repeated callbacks.
Metrics that expose real failures
Webhook monitoring for Gemini-powered document processing should measure more than HTTP status codes. A callback can return 200 while the workflow is logically broken. For example, the receiver might accept an event marked completed even though the extracted invoice total is missing. Technical success and business success need separate signals.
Useful metrics include event delivery latency, acknowledgment rate, retry count, duplicate rate, queue age, Gemini request duration, token usage, and completion quality. For quality, start with simple checks: required fields present, page count within an expected range, valid JSON schema, and confidence or review status where your application supports it.
Cost is another practical signal. A sudden increase in input tokens can indicate that an OCR step is sending repeated pages, while unusually long outputs can point to a prompt or parsing regression. Record model name and request size, but avoid logging raw document contents. Redact email addresses, account numbers, and other sensitive values before logs leave the application.
A useful latency view separates wait time into stages. If upload-to-start is 20 seconds, model processing is 8 seconds, and callback delivery is 90 seconds, the model may not be the problem. Your queue or receiver is probably congested.
Idempotency, retries, and duplicate events
Retries are normal. Networks fail, receivers time out, and a sender cannot always know whether your application committed a transaction before the connection closed. Webhook monitoring for Gemini-powered document processing should therefore treat duplicate delivery as an expected condition, not an extraordinary bug.
Give every event a unique event ID and store it with a processing status. When the same ID arrives again, return a successful response without repeating the expensive action. If your database supports a unique constraint, use it to protect against concurrent duplicate requests. Do not rely only on an in-memory cache; a restart can erase it.
Use exponential backoff with a maximum retry window on the sender. A reasonable sequence might retry after 10 seconds, one minute, five minutes, and 30 minutes, although the right schedule depends on business urgency. Permanent errors, such as an invalid signature or unsupported event type, should not retry forever. Send them to a dead-letter queue with enough context for replay.
A replay tool is worth building early. It should let an operator choose a failed event, inspect the original payload, correct a destination or configuration issue, and submit the event again without creating a second document record.

Security and operational checks
Webhook endpoints are public by nature, so authentication needs to be deliberate. Verify a signed request when the sending system supports signatures. Otherwise use a strong secret, restricted network access where practical, timestamp validation, and replay protection. Reject old timestamps and never place credentials in query parameters.
Set request timeouts and return an acknowledgment quickly. The receiver should validate the envelope, persist the event, and hand off expensive work to a queue. It should not wait for Gemini, OCR, database enrichment, and email delivery inside one HTTP request. Long-running requests create avoidable retries and duplicate work.
For document data, define retention rules for payloads, logs, intermediate files, and model outputs. A useful compromise is to keep metadata and error fingerprints longer than raw content. Access to prompts and extracted text should be limited, audited, and separated from general application logs.
Test the boring failures deliberately: malformed JSON, expired signatures, a slow receiver, a Gemini timeout, a rate-limit response, a database outage, and a callback that succeeds but returns an invalid business result. A workflow that only passes the happy path is not ready for production.
A production rollout checklist
Start with one document type and one destination system. Add correlation IDs before adding a dashboard, because charts without traceable examples lead to guesswork. Then capture baseline latency and failure behavior for several normal days.
Next, introduce schema validation for both model output and webhook envelopes. Store the raw response in a controlled location only when needed for debugging, and keep a redacted version for routine investigation. Add idempotency before enabling automatic retries; otherwise reliability features can multiply records.
Webhook monitoring for Gemini-powered document processing becomes much more valuable when alerts include an action. A notification should say which workflow failed, how many documents are affected, the first and latest occurrence, the likely stage, and a link to logs or a replay action. An alert that only says error rate high forces an engineer to reconstruct the incident manually.
Finally, test a controlled failure. Disable the callback receiver for a few minutes, restore it, and confirm that events retry, duplicates remain harmless, and the dashboard shows recovery. This exercise often finds missing permissions or retention problems before a real outage does.
What worked, what failed, and what I would change
In my experience, the strongest design is not the one with the most observability products. It is the one with a durable event ID, clear stage boundaries, safe retries, and alerts tied to customer impact. That combination makes webhook monitoring for Gemini-powered document processing understandable to both engineers and operators.
What commonly fails is treating a successful HTTP response as proof that document processing succeeded. It is only proof that one network interaction completed. Business validation, schema checks, and destination confirmation still matter.
I would start with logs, a small dashboard, a dead-letter queue, and a replay command before buying a large monitoring platform. Once volume, compliance needs, or multiple teams justify more tooling, connect those same structured events to your preferred system. I tried it first. You can just copy the pattern, then adapt the thresholds to your own documents, latency expectations, and Gemini workflow.